The eCommerce market is a rapidly evolving landscape that presents both opportunities and challenges for businesses of all sizes. Navigating the complexities of different markets, understanding local laws and regulations, and overcoming language and cultural barriers are some of the challenges.
On the other hand, it presents tremendous opportunities for businesses to expand their reach and increase their customer base like the following stats illustrate.
eCommerce Market Share Statistics and Analysis of Growth Trends:
Overview of the Global eCommerce Market
Global eCommerce is the selling of products or services across geopolitical borders from a company’s country of origin, normally defined as its founding or incorporating location. The eCommerce market has become increasingly global, as more businesses seek to expand their reach and tap into new markets.
Global eCommerce stats shared by Statista reveals that:
- In 2023, eCommerce was responsible for 19% of the global retail sales. What’s more, by 2027 it’s expected to account for about 25% of the total global retail sales.
- Global retail eCommerce sales will be more than $6.4 trillion in 2024 and will exceed $7 trillion by 2025.
The advantages of international eCommerce include:
- Easier expansion into foreign markets
- Shorter B2B sales cycles
- Quicker building of international presence
- Lower barriers to entry
Even if you’re not interested in reaching international audiences, you can still unlock growth opportunities that are driven by:
- The increasing use of smartphones
- Expanding internet infrastructure
- Growing consumer trust in online shopping
Regional Distribution of eCommerce Market Share
In the next five years, eCommerce sales in the following countries are expected to grow the fastest:
- United States
- India
- Mexico
- Argentina
- Brazil
While a global eCommerce revenue comparison reveals that China is currently ahead of the US, its compound annual growth rate (CAGR) predicted from 2024 to 2028 will be 1.85% lower than that of the US.
Comparison of eCommerce Market Share With Brick-and-mortar Retailers
Brick-and-mortar retailers and eCommerce businesses have been in a tug-of-war for market share for years.
In 2023, the United States was the country with the highest online shopping preference. About 43% of US consumers indicated that they preferred shopping online mostly.
However, in countries like New Zealand, Austria, and Finland, more consumers prefer in-store shopping.
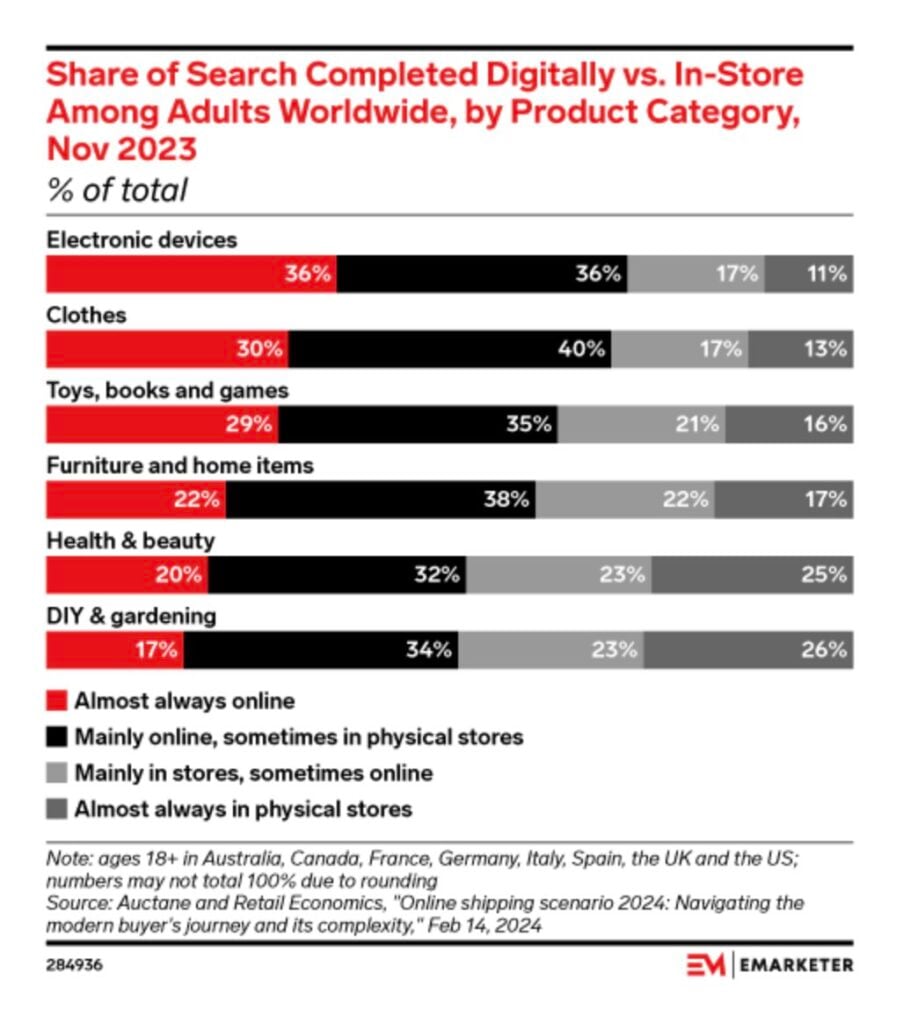
That being said, it’s not necessarily a case of either-or. For example, when it comes to buying electronics or clothing, consumers across the world prefer to search online over in-store.
A recent research paper titled Online Vs. Offline Shopping: A Theoretical Comparative Analysis explains that online shopping offers distinct advantages over offline shopping like:
- Easier price comparison
- Exclusive online-only deals and discounts
- Greater privacy as it eliminates face-to-face interaction
However, the inability to allow shoppers to inspect products physically, is one area where it still can’t compete. Delays in product delivery is another frustration when shopping online.
Major Players in the eCommerce Industry
Online marketplaces like Alibaba and eBay are still the most popular platforms for online shopping. More than a third of all global online shopping orders were placed via an online marketplace. To put this number into perspective, branded websites generated less than half the sales volume.
Here’s a quick overview of five of the main online marketplaces for eCommerce brands and sellers:
Amazon
Amazon needs no introduction. Co-founded in 1994 by Jeff Bezos, it’s the largest eCommerce company across the world in terms of market cap, well ahead of other eCommerce giants like Alibaba.
Here are some key facts about Amazon as a major player in the eCommerce industry:
- In 2023, Amazon had net sales revenue of nearly $575 billion. What makes this number even more impressive is that for the past two decades, its net revenue increased.
- The majority of Amazon's revenue is generated through e-retail sales of different product categories. In 2023, its online stores generated $231.87 billion.
- After its online stores, its retail, third-party seller services generate the most money. In 2023, this total added up to just over $140 billion.
- Amazon also offers subscription services that include Amazon Prime, an annual membership service that includes free and discounted shipping rates, which is considered a key advantage by many customers. The net revenue that Amazon has generated via its subscription services reached $40.2 billion in 2023.
It’s not only in terms of revenue that Amazon generates impressive figures. To make the money that it makes, it also needs a solid stream of online traffic and app downloads.
Here’s an overview of Amazon.com’s online traffic between June 2023 and November 2023:
- 6 billion direct visits
- Organic search generated almost 2 billion visits
- Social platforms contributed to about 370 million visits
Another noteworthy stat to mention is that it’s by far the most popular in the United States. The US generated over 80% of this traffic. To put this popularity in the US into better perspective, India, the country responsible for the second highest traffic, generated just over 1%.
Walmart
Along with Amazon, Walmart is another eCommerce giant in the US. It was founded in the early 1960s, long before the advent of online retail, but joined the space when it launched its online store in 2000.
It operates a number of chains of discount departments and warehouse stores and is divided into the following segments:
- Walmart US
- Walmart International
- Sam’s Club
Walmart US accounts for over half (53.4%) of its online sales. It’s followed by Walmart International that generates 20.3% of online sales, while Sam’s Club records only 8.4% of its online sales. Since 2019, all three of these segments have managed to increase their sales, with Walmart US showing slightly more growth.

It’s especially its grocery business that’s driving business. Walmart US grocery eCommerce sales added up to about $38 billion for its financial year ending January 31, 2023. While it’s only 15.5% of its net grocery sales total, it accounts for nearly half of all eCommerce sales.
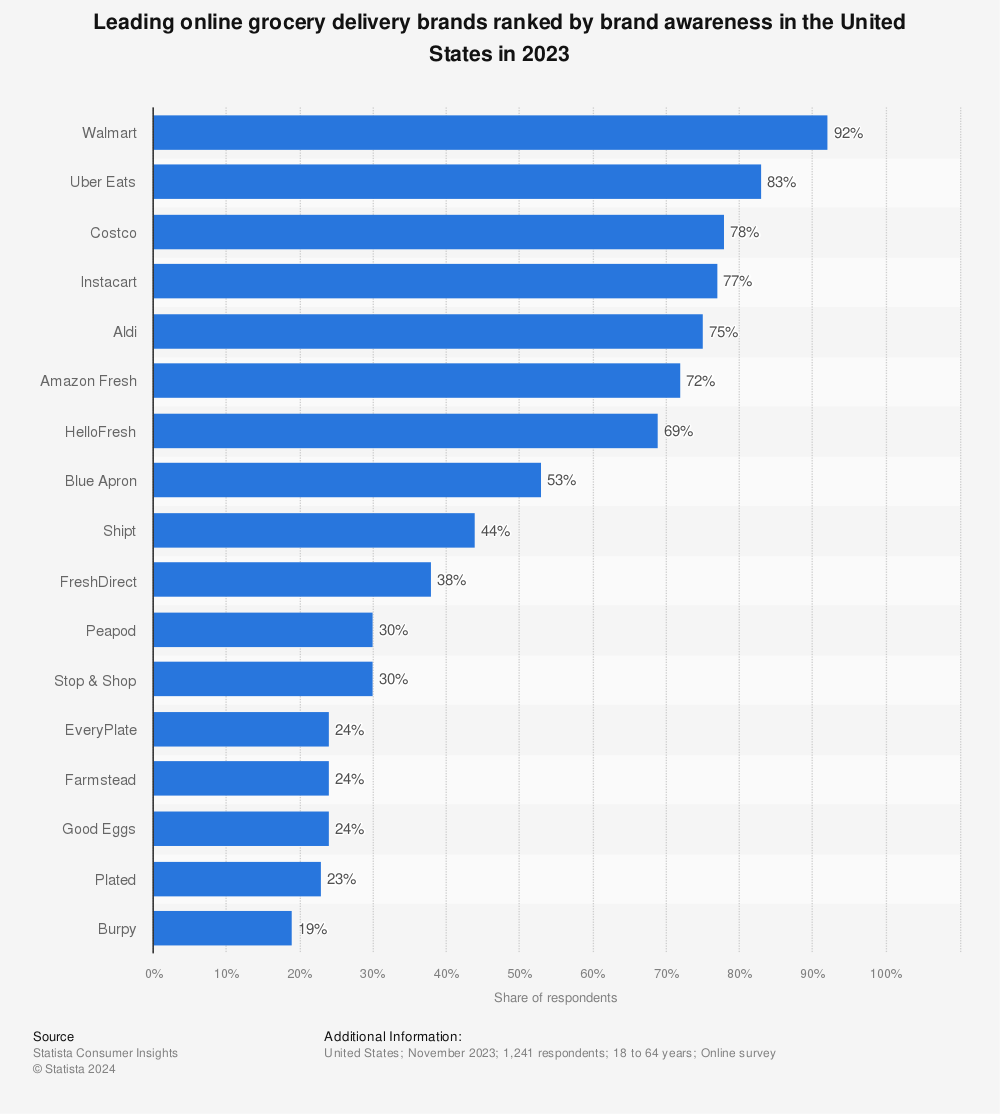
Plus, it shows no signs of slowing down. Brand awareness of Walmart in the US measures 92%, making it the leading online grocery delivery brand.
Here are some other key facts about Walmart as a major player in the eCommerce industry:
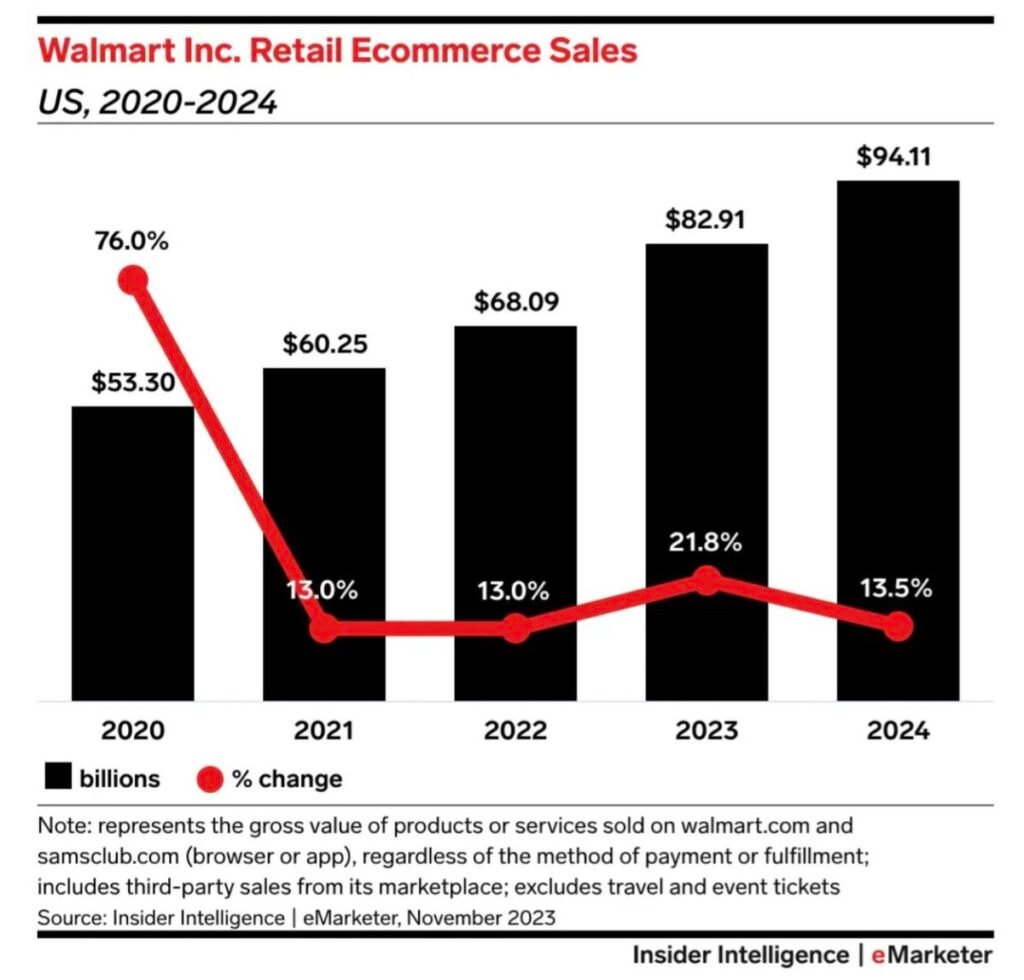
- In 2023, Walmart’s retail eCommerce sales added up to nearly $83 billion. This is an increase of just over 20% on 2022’s performance.
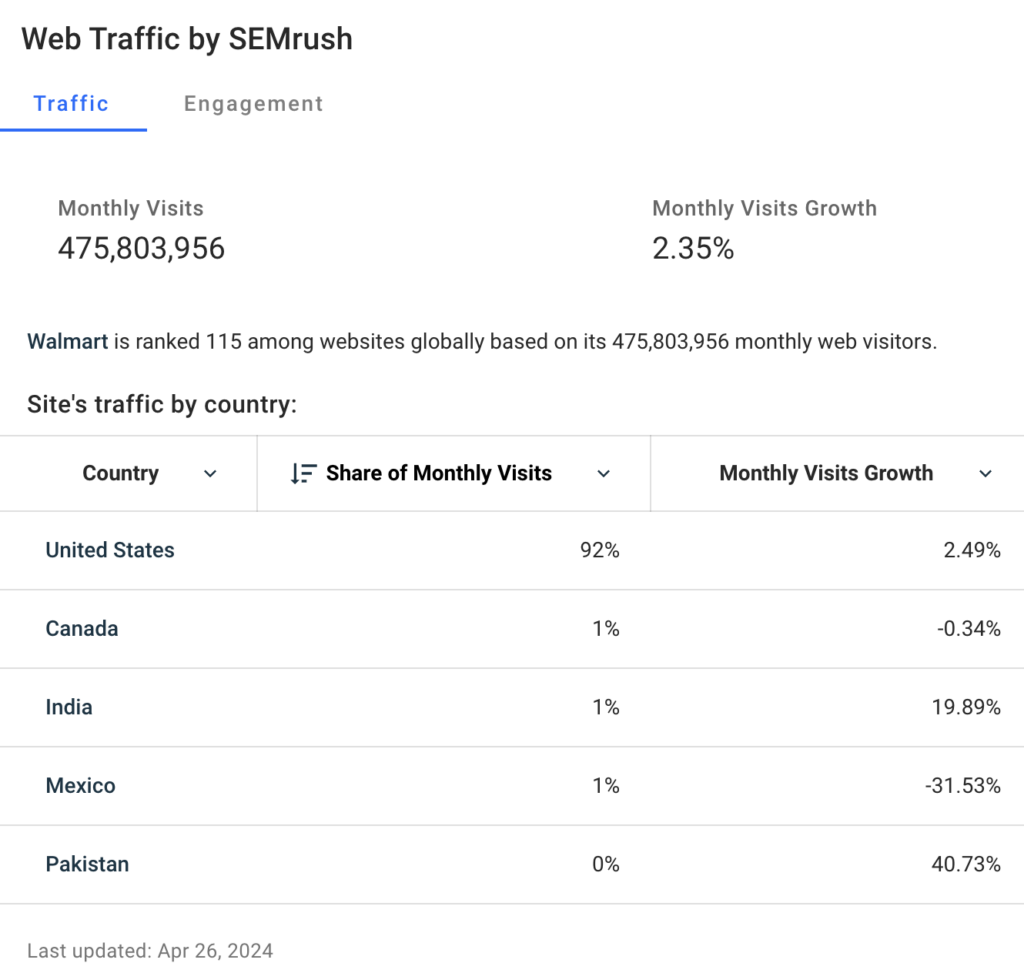
- In terms of website visits, it attracts about 475 million monthly website visitors, placing it 115th among websites globally.
- Walmart Marketplace has also shown promising growth. Within 18 months, it has doubled in size to reach 100,000 active sellers.
As for its future, here’s what forecasts predict:
- In 2024, its retail eCommerce sales will add up to $94.11 billion.
- In 2024, US grocery eCommerce sales will reach nearly $60 billion to account for over a quarter of the total grocery eCommerce sales in the US.
- By 2027, its click-and-collect service will represent over 40% of all grocery eCommerce sales in the US.
Alibaba Group
Over in China, Alibaba Group is the undisputed king of eCommerce. It was founded in 1999, a year before Walmart entered into the online retail space. In 2023, it was the second leading Asian brand in terms of brand value across the world, after Tencent.
However, according to a stat published by Júlia Faria, research team lead at Statista, it suffered the highest brand value loss in 2023 across the world. Its brand value decreased by 56.

Its business spans across multiple categories including:
- B2B
- B2C
- C2C eCommerce
- Cloud computing
- Local service
- Logistics
- Financial services
Here are some key facts about Alibaba Group, showing why it’s still rated as a major player in the eCommerce industry even after its significant loss in brand value:
- On Crunchbase, it’s ranked in 165th spot, well ahead of Amazon and Walmart. In short, the Crunchbase rank measures a company’s prominence using intelligent algorithms that take into account factors like: the level of community engagement, funding events, and acquisitions.
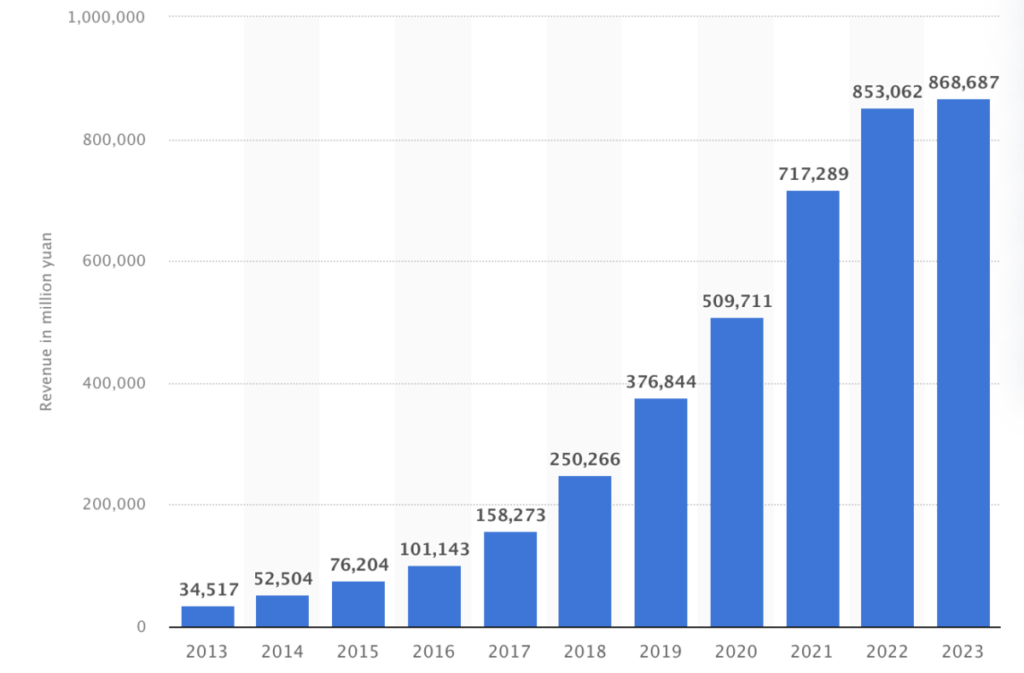
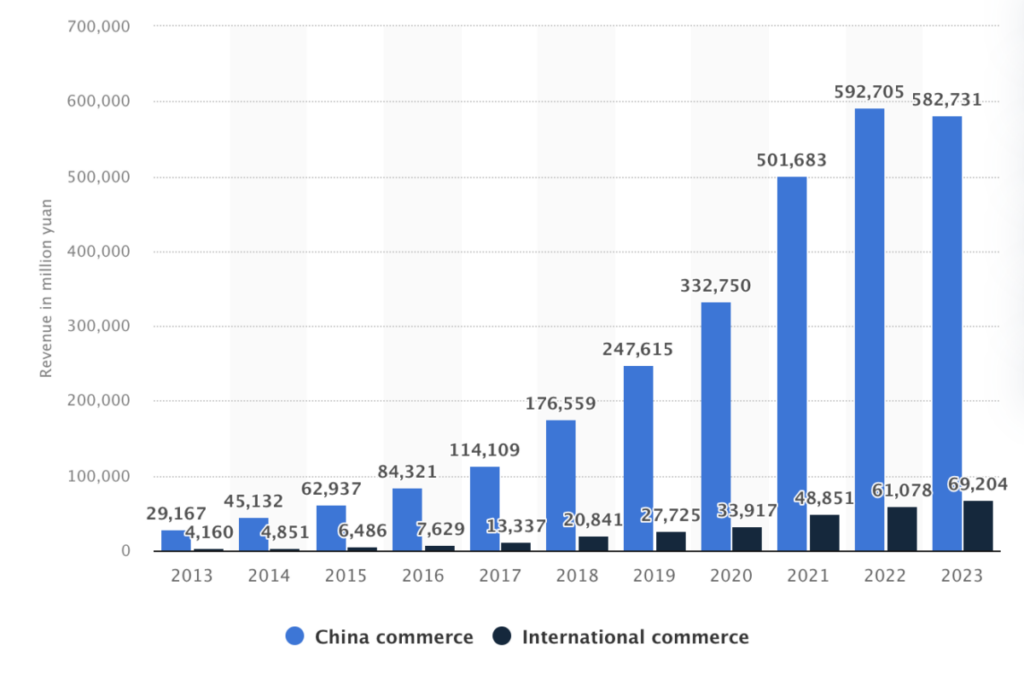
- In the financial year ending March 31, 2023, Alibaba Group's revenue exceeded 868 billion yuan. This works out to about $127 billion.
- Chinese-based eCommerce accounts for the biggest chunk of the group’s revenue. In 2023, it added up to just over 580 billion yuan, 65% of the company’s revenue.
- International eCommerce revenue amounted to nearly 70 billion yuan in 2023.
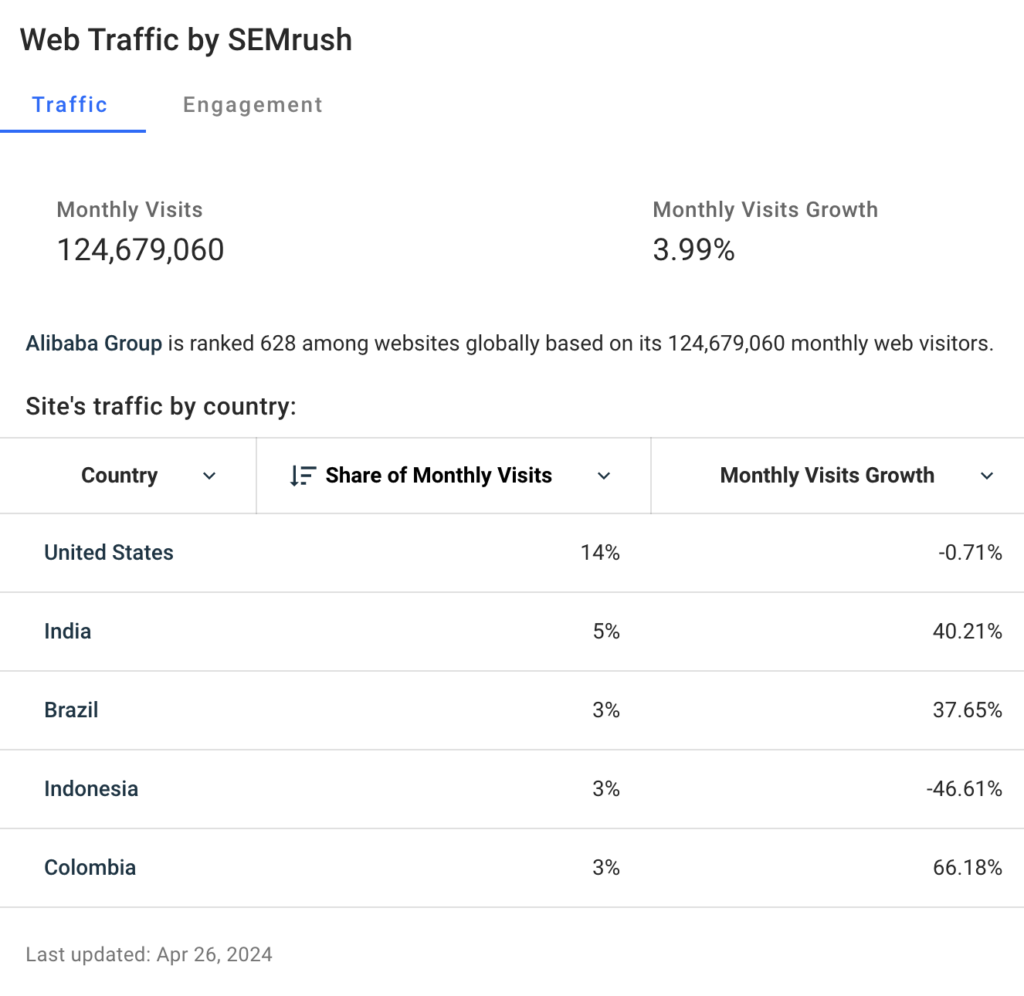
- In terms of web traffic, it attracts about 125,000,000 monthly visits.
As for its future, here’s what forecasts predict:
- Its online sales in China alone will exceed $1.3 trillion by 2026.
- Electrical goods as well as leisure and entertainment items will be two popular categories. The net sales for these two categories in 2026 will add up to more than $373 billion and $160 billion respectively.
Etsy
Founded in 2005, Etsy is an online marketplace that connects customers with artists, crafters of handmade items, and collectors of vintage products. The platform engages in customer-to-customer (C2C) or peer-to-peer (P2P) eCommerce.
Here are some key Etsy stats showing why it can offer competition to the likes of Amazon:
- In 2023, its revenue totaled $2.7 billion. Most of its revenue is generated from its marketplace segment, powered by the fees users pay to sell their products on the company's online platform (a potential problem you’ll learn later).
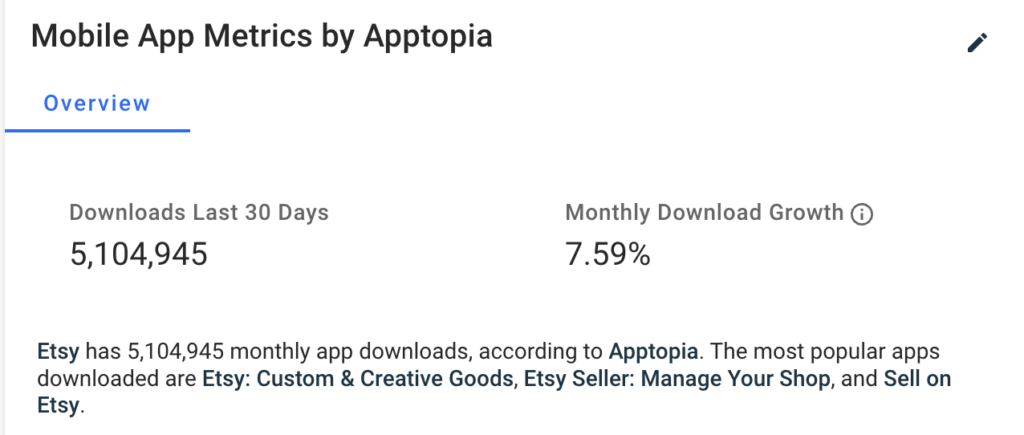
- The US is its biggest market and by a long shot. Its buyer app was downloaded over 53 million times between 2015 and 2023, while its seller app was downloaded more than 10 million times during the same period. On average, the app generates about 5 million monthly app downloads.
- It boasts about 96 million active buyers across the world and 9 million active sellers, according to its first quarter 2024 results.
Overall, Etsy's unique focus on handmade and vintage items has helped it carve out a niche in the crowded eCommerce marketplace. For example, Caitlyn Minimalist, an Etsy seller who sells handmade, personalized jewelry, recorded more than 49,000 sales in a single month. To date, she’s generated over 3 million sales.

Etsy: Caitlyn Minimalist
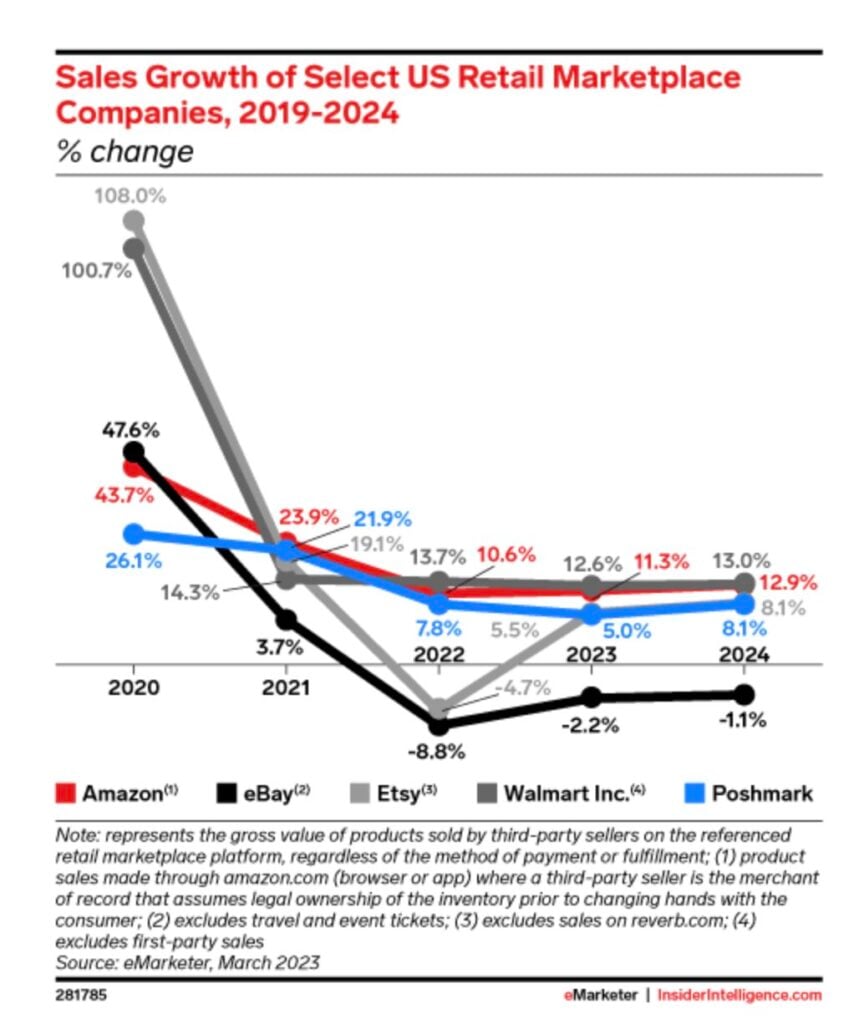
However, the company's recent fee increase and vendor strike in 2022 demonstrate that it still faces challenges in balancing the needs of its users with the need for growth and profitability.
There’s also been a slump in sales. Plus, its number of buyers haven’t grown nearly at the same rate as its number of sellers.
As a result, it laid off about 11% of its workforce.
A recent article shared by EMARKETER suggests that it will need to broaden its reach to move beyond its niche in a way that remains true to its brand, if sales aren’t going to pick up.
Temu
Founded only in September 2022, Temu is the new kid on the online marketplace block. It’s the sister company of Pundoiduo. Combine this connection with the fact that it’s headquartered in the Asia-Pacific (APAC) region, it’s tremendous growth in the first year as illustrated by these stats comes as no surprise:
- In fewer than nine months after it was launched, Temu already generated about $635 million in gross merchandise volume.
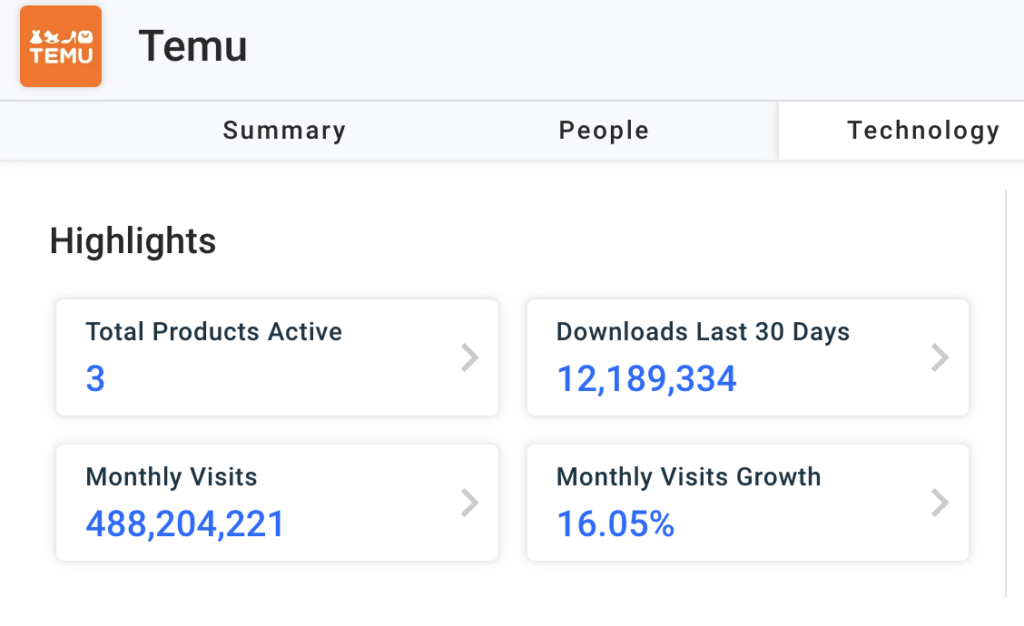
- It’s showing impressive growth in terms of website visits. It boasts close to 500 million monthly visits on average, with its monthly visits growing by over 16%.
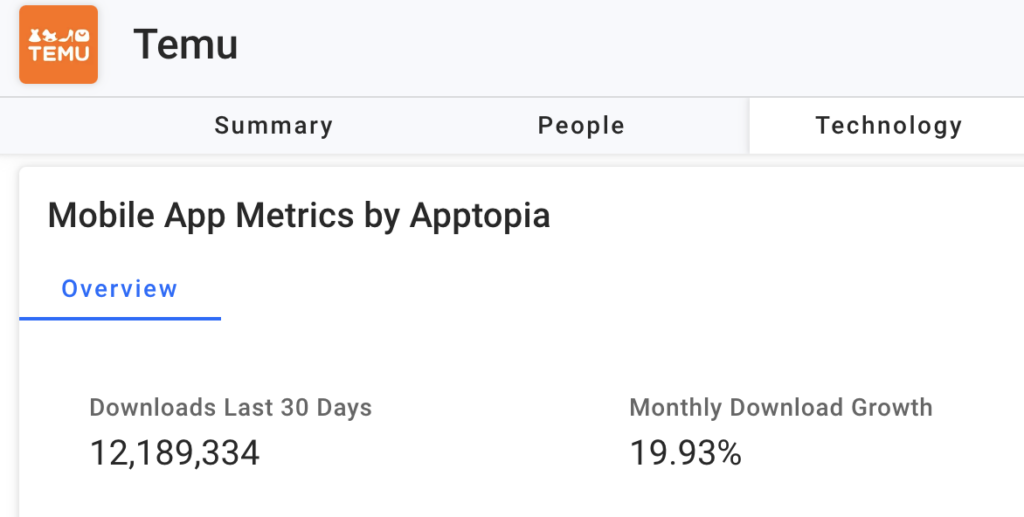
- In terms of mobile app downloads, it shows even more impressive growth with a monthly download growth of just below 20%. Data published by Lai Lin Thomala, a senior market researcher at Statista, puts the Temu shopping app’s downloads for the month of April at more than 46 million, placing it ahead of Amazon’s marketplace app.
- Its popularity isn’t restricted to the APAC region, though. After five months of launching, it already boasted more than 100 million active users in the United States. In fact, most recently the US (and Mexico) were also the biggest markets for Temu app downloads. Nearly a third (28%) of app downloads between April and May 2024 came from these two markets.
EMARKETER explains that it’s not just its competitive prices that are driving its growth. It’s a great example of how to use social media marketing. It has invested 76% of its ad spend on social media.
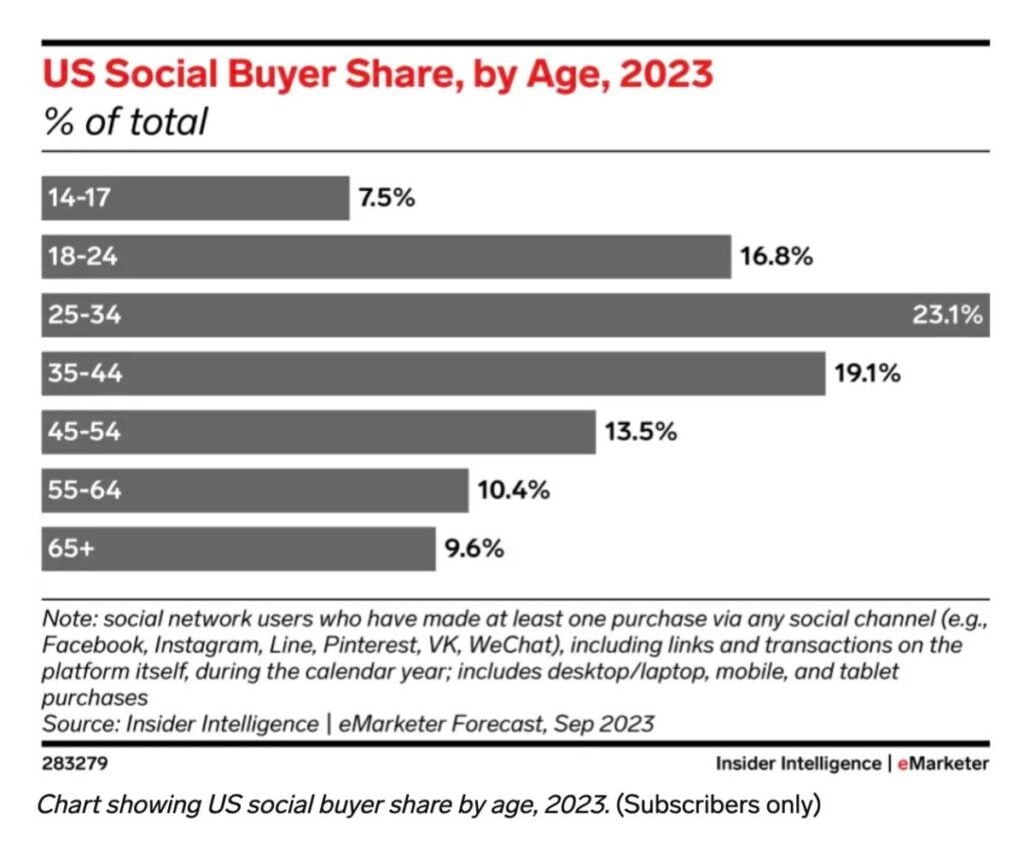
More specifically, almost half of this budget went to Facebook. This has helped it to find favor among older online shoppers. Bloomberg reports that boomers and Generation X shopped twice as often on Temu compared to Gen Zers.
Aside from its reliance on Facebook, Entrepreneur attributes its intuitive interface, attractive variety of products, and gamification strategies as more possible reasons for its loyalty among older audiences.
Mobile Commerce Growth
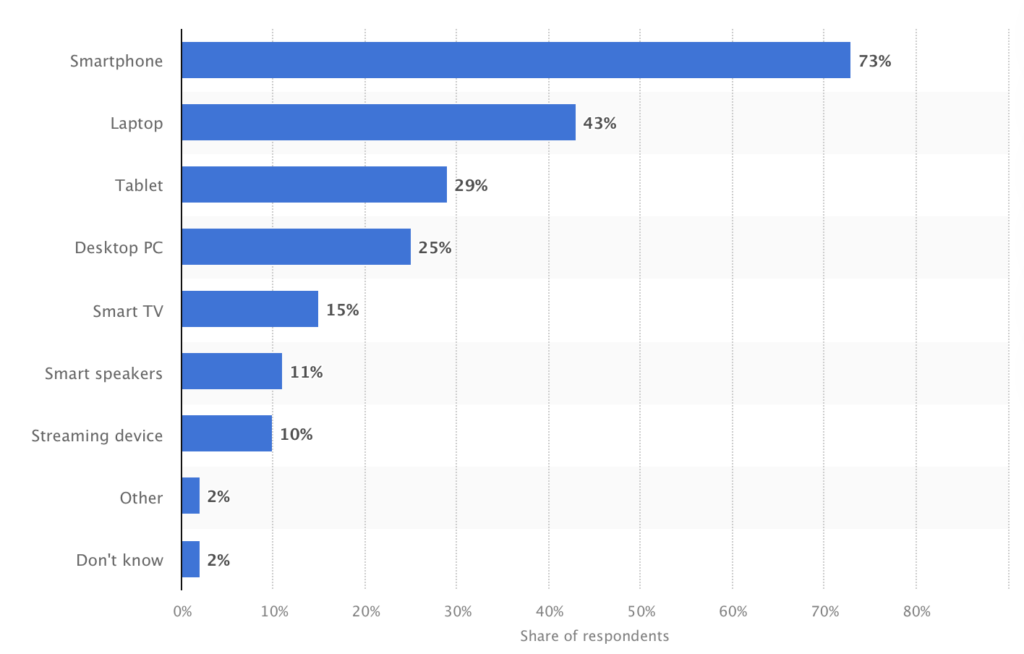
Mobile commerce, or m-commerce, is rapidly growing thanks to the widespread use of smartphones (the most commonly used device for online purchases) and tablets worldwide. At the beginning of 2024 mobile traffic to US retail websites increased by 5%.
According to forecasts, the rest of 2024 is also expected to be a big year for mobile commerce. EMARKETER’s November 2023 forecast predicts that US retail mCommerce sales will add up to nearly $560 billion. This will work out to about 44.6% of the total US retail eCommerce sales and in 2027 it will possibly reach 50%.
In the UK, the picture looks even more favorable for mobile commerce. According to a stat published by Daniela Coppobla, a senior eCommerce researcher at Statista, by 2027, mCommerce will drive about 57.6% of the total online shopping market here.
And, by 2028, it’s forecasted that mobile commerce’s proportion of global retail eCommerce sales will be 63%.
Social Commerce Growth
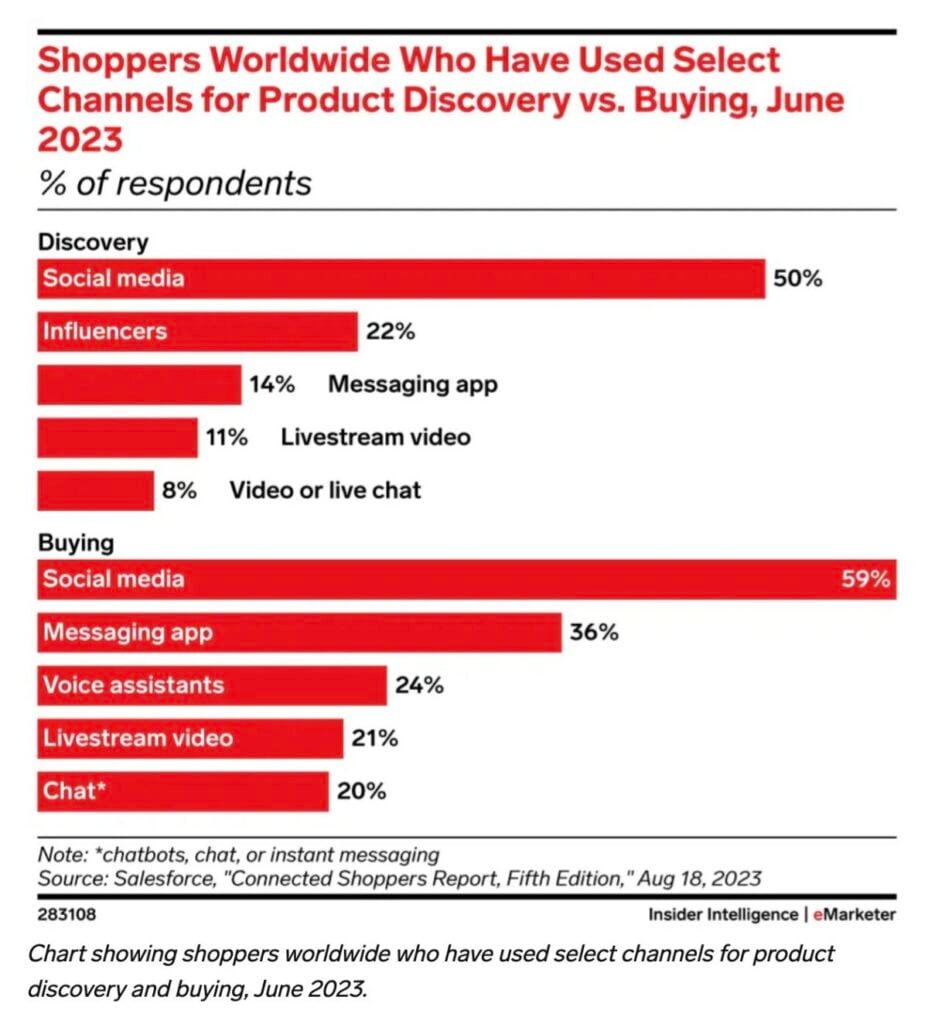
Social commerce (the integration of eCommerce and social media) has become a rapidly growing market with significant potential for retailers worldwide. In 2023, sales via social channels across the world added up to $571 billion, about 18.5% of all online sales across the globe.
Forecasts shared by Statista Research Department show no sign of its growth slowing down. It’s expected to exceed $1 trillion by 2028.
Social media platforms, such as Facebook and Instagram, are becoming essential tools for retailers. As consumers can now make purchases without leaving the platform, it enables a fast and direct customer journey.
However, it’s the deals and discounts that’s the driver for social commerce’s increase in popularity. Nearly 4 out of 10 social shoppers list this as their main motivation for buying via social media.
Currently, it’s also more popular among buyers from Thailand, Colombia, and China. In each of these three countries, more than 90% of online consumers have made a purchase via a social network.
As for what consumers buy, these were the most popular categories in 2023:
- Apparel
- Accessories
- Groceries
- Food supplies
What Are the Key Factors Driving the Growth of eCommerce?
Convenience and accessibility
One of the major drivers of eCommerce growth is the convenience and accessibility it provides to consumers. Online shopping allows customers to browse and purchase products from the comfort of their own homes, without the need to visit a physical store.
eCommerce has also made it easier for consumers to access products that may not be available locally, thereby increasing their shopping options.
Personalization and customization
Another factor driving eCommerce growth is the ability for online retailers to personalize and customize the shopping experience for each individual customer. With the use of data analytics and machine learning, eCommerce platforms can track a customer's browsing and purchasing history to make personalized recommendations, offer discounts, and tailor marketing campaigns.
This personalization can lead to increased customer loyalty and repeat business. In fact, nearly half (45%) of millennial and Gen Z online shoppers want to receive personalized product recommendations when shopping online.
Competitive pricing
eCommerce has also been able to drive growth through its competitive pricing. Online retailers are often able to offer lower prices than their brick-and-mortar counterparts due to lower overhead costs. Additionally, eCommerce platforms can easily compare prices across multiple retailers, giving consumers the ability to find the best deals quickly and easily.
Technological advancements
The rise of mobile devices has made it easier for consumers to shop online from anywhere at any time. Additionally, improvements in payment systems and logistics have made online transactions more secure and efficient. These advancements have also made it easier for small businesses to enter the eCommerce market and compete with larger retailers.
That said, there’s still room for improvement. More than half (55%) of Gen X online shoppers want eCommerce sites to improve their frictionless payment methods.
Changing consumer behavior
Finally, changing consumer behavior is a key factor driving the growth of eCommerce. With the increasing use of technology and social media, consumers are becoming more comfortable with making purchases online.
Additionally, younger generations are more likely to prefer online shopping to traditional brick-and-mortar stores. As these trends continue, eCommerce is expected to become an even more important part of the retail landscape.

